The Strategic Mandate of Corporate Development: Transforming M&A from Reactive Deal Fever to a Programmatic Growth Engine
Exhibit 1: The 5-Stage M&A Deal Sourcing Funnel & Attrition Gates: Universe to Executed Transaction

Simulate & Prototype: Corporate Development & M&A Deal Sourcing Presentation Guide: Pipeline, Screening & Board Decks
Drag to draw custom components, test consulting layout presets, and preview presentation architecture live before generating with AI.
Table 1: Corporate Development Sourcing Channel Taxonomy: Origination Vectors, Win Rates, Valuation Arbitrage & Sourcing Cycle Times
Executive Summary: Core Principles for High-Conviction Corporate Development Decks
Sourcing Channel Mechanics: Proprietary Outreach, Thesis-Driven Sourcing vs. Investment Banker Auctions
The Corporate Development Target Screening & Disqualification Gate: 10 Non-Negotiable Diligence Filters
Strategic Screening Architecture: Filtering Deals by Thesis Fit, Moat Defensibility, and Operational Synergy
Exhibit 2: Strategic Attractiveness vs. Transaction Feasibility 3x3 Target Prioritization Matrix

Table 2: Multi-Factor Target Qualification & Disqualification Scorecard: Evaluation Dimensions, Threshold Metrics & Disqualification Triggers
Buy vs. Build vs. Partner: The Capital Allocation & Strategic Execution Decision Tree
Table 3: Buy vs. Build vs. Partner Analytical Trade-off Matrix: Economic Hurdle Rates, Time-to-Market, Technology Moat & Post-Deal Integration Friction
Target Profiling & Preliminary Financial Underwriting: Valuations, Multiples, and Synergies
Exhibit 3: Buy vs. Build vs. Partner Strategic Evaluation Framework

Table 4: Multi-Target Acquisition Candidate Scorecard: Financial Accretion, Strategic Value, Synergy Potential & Risk-Adjusted Ratings
M&A Pipeline Governance & The Stage-Gate Flight Path: Managing the Funnel from Sourcing to Confirmatory Diligence
The Executive M&A Committee & Board Indication of Interest (IOI) Decision Gate: 10 Governance Checks
Exhibit 4: Multi-Target Acquisition Screening Scorecard & Synergy Tear Sheet
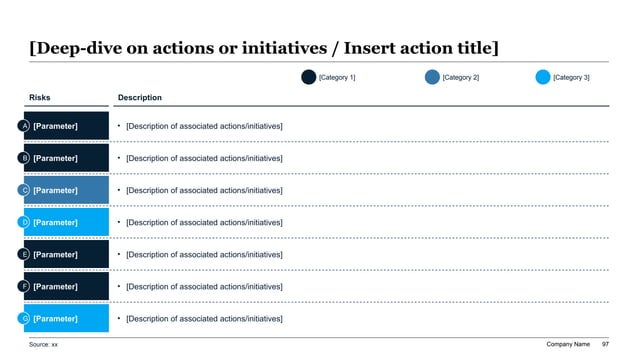
The 8-Slide Corporate Development M&A Pipeline Presentation Blueprint
Exhibit 5: Corporate M&A Pipeline Governance & Stage-Gate Flight Path Gantt

Common Corporate Development Anti-Patterns: Why M&A Pipelines Stall and How Top Teams Avoid Value Destruction
Executive XLSlides Prompt Recipe: Generating High-Conviction Corporate Development & M&A Pipeline Decks
Act as an elite Vice President of Corporate Development and former M&A Strategy Partner at McKinsey & Company. You are preparing an institutional, decision-ready 8-slide M&A Pipeline & Deal Sourcing Review presentation for the Chief Executive Officer, Chief Financial Officer, and Board M&A Committee of a multi-billion dollar enterprise. Structure your presentation to be rigorous, analytical, executive-ready, and grounded in answer-first MECE principles: 1. Core Executive Thesis & Telemetry Dashboard: - Establish the strategic headline for the monthly pipeline review: summarize total active deal count, aggregate enterprise value under review, and specific capital commitments requested today. - Highlight four telemetry metrics: (1) Total Active Pipeline Enterprise Value; (2) Percentage of Pipeline Originated Bilaterally via In-House Proprietary Thematic Sourcing; (3) Weighted Average Sourcing Multiple vs. Buyer Trading Multiple (Multiple Arbitrage Spread); (4) Pro-Forma Balance Sheet Leverage Headroom (Net Debt / EBITDA). 2. Thematic Sourcing Funnel & Attrition Analysis: - Present the mathematical 5-stage deal funnel tracking conversion and attrition: Universe Longlist (250+ companies) -> Phase 0 Thematic Filtering (45 companies) -> Phase 1 Active Management Outreach & NDA (15 companies) -> Phase 2 Active Due Diligence & Preliminary Valuation (5 companies) -> Phase 3 Binding Letter of Intent (LOI) & Exclusivity (1-2 closed transactions). - For each funnel stage, state the primary disqualification filter applied (e.g., lack of thesis fit, gross margin floor violations, customer concentration risks, or unrealistic valuation expectations). 3. Multi-Target Acquisition Candidate Scorecard: - Construct an executive comparison matrix evaluating 4 priority acquisition targets: Project Apex (Cloud Governance), Project Beacon (Workflow Automation), Project Cobalt (AI Document Intelligence), and Project Delta (Healthcare Analytics). - For each target, provide: (1) Strategic capability vector; (2) Sourcing channel (Proprietary vs. Banker); (3) Standalone LTM Revenue, 3-year CAGR, Gross Margin %, Standalone EBITDA %; (4) Proposed Enterprise Value and EV/EBITDA multiple; (5) Hard annual cost synergies (capped at 80% realization); (6) Cash EPS accretion in Year 1/Year 2 and 5-year unlevered IRR; (7) Executive Committee recommendation (Advance to LOI, Issue Capped IOI, Disqualify, or Terminate). 4. Priority Target Deep-Dive & Buy vs. Build Justification: - Provide an institutional tear sheet for the top-priority candidate (Project Apex): detail the core strategic moat, enterprise customer lock-in, and normalized historical cash flow bridge. - Present a rigorous Buy vs. Build vs. Partner analytical trade-off table comparing the proposed acquisition against organic internal R&D across Time-to-Market (months saved), Fully Loaded Capital Investment, IP Ownership Defensibility, Integration Friction, and Net Present Value. 5. Capital Allocation, Leverage Safety & Confirmatory Diligence Flight Path: - Model the pro-forma sources and uses of transaction capital, verifying that total enterprise leverage remains well within credit facility boundaries (Net Debt / EBITDA < 2.5x). - Include a multi-track operational Gantt timeline detailing the 45-day confirmatory diligence flight path across Quality of Earnings accounting, legal SPA negotiation, technical IP audits, and Day-1 Integration Management Office (IMO) cutover. Tone and Output Formatting: Write in concise, data-dense executive language without marketing hype or filler phrases. Utilize clear action titles, bulleted takeaway panels, structured comparison tables, and exact mathematical financial formulas. Ensure the deck provides executive leadership with the precise clarity required to allocate capital with absolute confidence.