Genetic Sequencing Research Results Template

Stop wasting hours on manual formatting. Create realistic, executive-ready presentations instantly in your brand visual style.

Genomic data visualizations
Sequencing methodology blocks
Variant analysis dashboards

1What Is a Genetic Sequencing Research Results Deck?

A genetic sequencing research results deck is the presentation used to explain sequencing study design, data generation, quality control, analysis workflow, variant findings, and research implications. It must translate complex genomic outputs into a narrative that different audiences can evaluate: scientists need methodological rigor, executives need implications and resource decisions, investors need progress and risk, and clinical advisors need confidence in interpretation boundaries. A good deck does not dump tables of variants onto slides. It explains the research question, cohort, sequencing platform, coverage, quality metrics, analytical pipeline, key findings, limitations, and next steps. This template helps teams structure that story in a way that preserves scientific credibility while remaining readable. It is useful for next-generation sequencing, whole genome sequencing, exome sequencing, targeted panels, transcriptomics, and translational research updates where evidence quality matters as much as the findings. It also helps separate confirmed results from exploratory signals before stakeholders overinterpret early data.
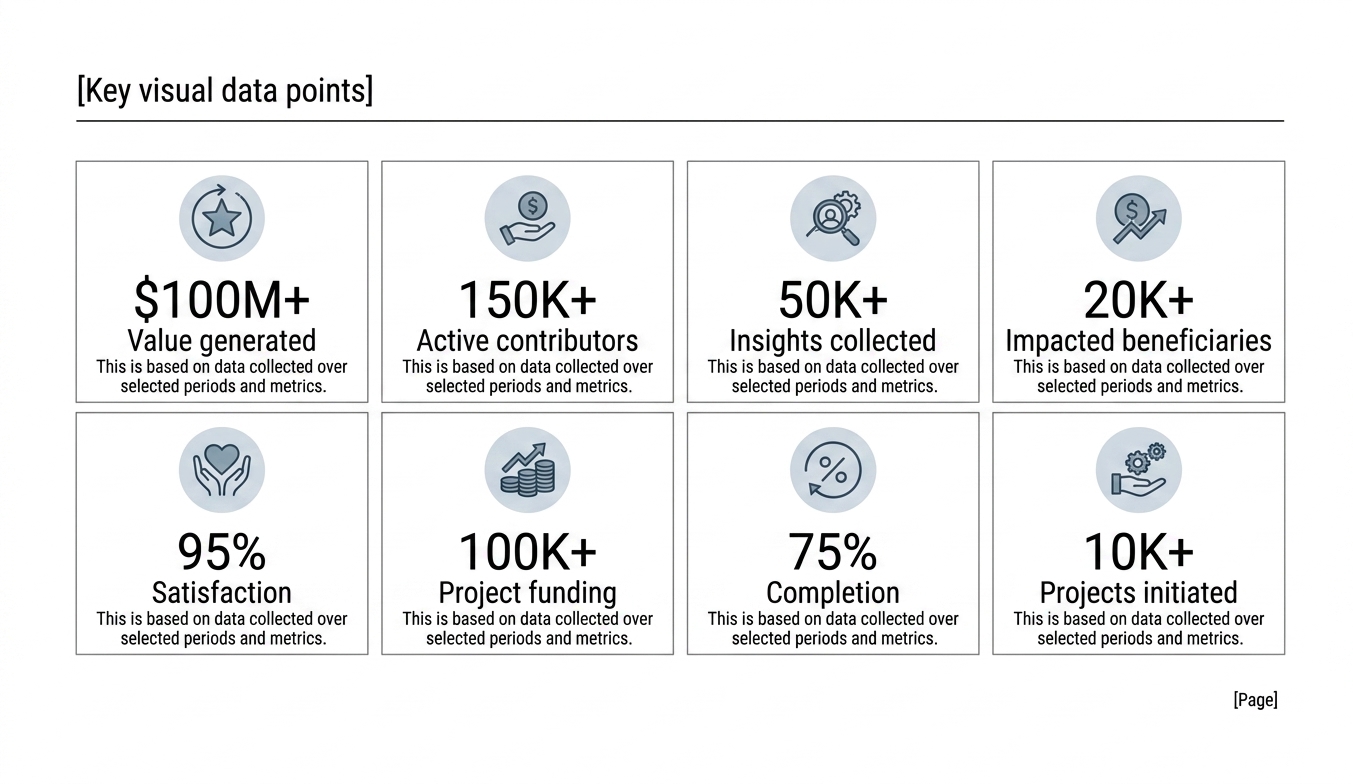
Genetic sequencing research dashboard slide with eight metric cards for cohort size, insights collected, completion, funding, and project outcomes
Template Design LayoutGenetic Sequencing Research Results Template

2When to Use This Sequencing Results Template

Use this template when a sequencing project needs to be reviewed, funded, published, scaled, or translated into a research or clinical decision. Common use cases include biotech investor updates, grant progress reports, research consortium meetings, clinical genomics reviews, laboratory performance readouts, variant discovery summaries, biomarker program updates, or internal R&D stage-gate decisions. It is also useful when a team has strong data but needs to explain it to stakeholders who are not deep bioinformatics specialists. The deck gives researchers, lab teams, data scientists, clinical leads, and business stakeholders a shared structure for evaluating whether the sequencing work is complete, reliable, and decision-relevant. Instead of presenting isolated findings, the template makes the evidence chain visible: cohort selection, sample processing, sequencing quality, analysis methods, interpretation, limitations, and next actions. That structure reduces confusion and supports better scientific review. It also helps leadership decide whether additional validation is justified before committing scarce research budget.

3Recommended Sequencing Results Deck Structure

A decision-ready genetic sequencing results presentation usually follows a ten-slide narrative. Start with the executive research summary: what question was tested, what was found, and why it matters. Then show cohort design, sample characteristics, sequencing platform, assay scope, and inclusion or exclusion criteria. Next, present methodology and quality control, including coverage, read depth, mapping rate, contamination checks, call rate, and sample pass rates. The middle section should explain the bioinformatics pipeline, variant filtering logic, key findings, pathway or phenotype associations, and interpretation boundaries. After that, include a metric dashboard summarizing cohort size, completed samples, variants detected, candidate findings, validation status, and remaining gaps. Close with limitations, follow-up experiments, publication or regulatory pathway, and decisions required. This structure works because it separates scientific evidence from interpretation and avoids hiding uncertainty behind polished results. It keeps reviewers oriented as technical complexity increases and prevents premature claims during scientific review meetings with stakeholders.

4Cohort Design, Samples, and Study Context

Sequencing results are only as credible as the cohort and sample context behind them. The deck should define the study population, sample type, disease area or phenotype, inclusion criteria, exclusion criteria, control group, consent boundaries, collection period, and any batch or site differences. For translational or clinical research, stakeholders will want to know whether the cohort is representative enough to support the interpretation. For discovery work, they may need to understand whether the sample size is sufficient for hypothesis generation rather than definitive claims. Sample quality also matters: DNA or RNA input, degradation, contamination, storage conditions, and extraction method can all affect downstream findings. A clear cohort slide helps reviewers understand what the results can and cannot prove. It also gives business and research leaders a practical view of whether more samples, validation cohorts, or improved collection protocols are needed before the project advances. Include demographic or phenotype balance where relevant.

5Sequencing Methodology and Quality Control

A credible sequencing results deck must show the method and quality thresholds used to generate the data. Include the sequencing platform, library preparation method, panel or genome scope, read length, target depth, average coverage, uniformity, mapping rate, duplication rate, base quality, call rate, contamination checks, and sample pass or fail criteria where relevant. If the project used whole genome, exome, targeted panel, RNA-seq, single-cell, or long-read sequencing, explain why that method matched the research question. Quality control should not be treated as a technical appendix only. It determines whether downstream variant interpretation is trustworthy. The deck should highlight any sample failures, batch effects, low-coverage regions, or assay limitations that affect interpretation. Presenting QC clearly builds confidence with scientific reviewers and prevents executives from over-reading findings that still require validation. It also helps lab operations teams identify process improvements for future runs. QC thresholds should be stated before findings are discussed.

6Bioinformatics Pipeline and Variant Filtering

The bioinformatics section should make the analysis workflow understandable and auditable. Show the pipeline from raw reads to alignment, preprocessing, variant calling, annotation, filtering, prioritization, and interpretation. Name the major tools or workflow stages if appropriate, but keep the slide focused on analytical logic rather than software inventory. Reviewers need to know how false positives were controlled, how low-confidence calls were filtered, how known databases were used, and how candidate variants were prioritized. For research presentations, variant filtering may include allele frequency, predicted functional impact, inheritance pattern, phenotype relevance, pathway involvement, or recurrence across samples. For clinical or translational presentations, interpretation boundaries and classification criteria are especially important. A clear pipeline slide helps stakeholders trust that findings were not cherry-picked. It also makes it easier to identify where validation, replication, or manual review is still needed before conclusions are treated as robust. Versioning and reproducibility should be noted for auditability.

7Key Findings and Variant Interpretation

The findings section should translate sequencing outputs into a small number of decision-relevant messages. Instead of listing every variant, group findings by biological implication, phenotype association, pathway, disease relevance, therapeutic hypothesis, or research priority. A strong slide might show candidate variants, affected genes, recurrence, predicted impact, confidence level, validation status, and interpretation notes. If the project is exploratory, state that clearly and avoid implying clinical certainty. If findings are clinically relevant, clarify whether they are pathogenic, likely pathogenic, VUS, benign, or research-only according to the appropriate interpretation framework. The deck should also explain negative or inconclusive findings where they matter. Scientific stakeholders appreciate transparency about uncertainty, while executives need to know what the findings change. A good interpretation slide connects genomic evidence to next steps, such as validation assays, functional studies, expanded cohort analysis, clinical consultation, or product development decisions. Prioritize findings by confidence and implication for action and investment.

8Metric Dashboard for Sequencing Results

The suggested eight-card dashboard image works well for summarizing sequencing results because genomics stakeholders need both scientific and operational metrics. Useful cards include samples collected, samples sequenced, pass-rate percentage, average coverage, variants detected, candidate variants prioritized, validation experiments completed, and insights or hypotheses generated. For lab operations, include turnaround time, failed samples, cost per sample, re-run rate, and pipeline completion. For research leadership, include cohort completion, analysis milestones, funding usage, publication readiness, or follow-up experiments initiated. The key is to avoid vanity metrics that look impressive but do not support a decision. Each metric should answer whether the project is complete, reliable, interpretable, and ready for the next stage. A compact dashboard gives executives a fast status view while preserving enough scientific detail for technical reviewers to ask informed questions. It also helps track progress across repeated research updates. Pair dashboard metrics with source definitions and thresholds for consistency across programs.

9Limitations, Validation, and Follow-Up Experiments

Genetic sequencing results should always include limitations and validation needs. Limitations may include sample size, cohort bias, low coverage regions, assay blind spots, variant classification uncertainty, limited phenotype data, batch effects, population stratification, or lack of functional validation. A strong deck explains which limitations materially affect the interpretation and which are acceptable for the stage of research. It should also define the follow-up plan: orthogonal validation, Sanger confirmation, qPCR, functional assays, expanded cohort sequencing, family segregation, replication in an independent dataset, or clinical review. This section protects scientific credibility because it shows that the team understands the boundary between signal and proof. It also helps executives fund the right next step rather than overinvesting in conclusions that are not yet validated. A good limitations slide does not weaken the story; it makes the research more trustworthy and stage-appropriate. State which claims remain preliminary and why before broader communication or funding decisions.

10Decision Roadmap for Research and Development

A sequencing results deck should close with a roadmap that turns findings into next actions. The roadmap may include additional sequencing, validation experiments, bioinformatics refinement, clinical interpretation review, regulatory consultation, publication preparation, partnership discussions, product development, or grant milestones. Each action should name the owner, evidence required, timing, resource need, and decision gate. For biotech or translational teams, the roadmap should show how sequencing evidence affects target selection, biomarker strategy, patient stratification, companion diagnostic thinking, or clinical study design. For academic teams, it may focus on replication, manuscript development, and collaboration. The important point is that research results should not end as a static readout. They should guide what the team does next. A decision roadmap helps stakeholders see whether the sequencing work supports continuation, expansion, validation, or a change in scientific direction. It also clarifies funding needs, dependencies, and timing for leadership review and governance gates clearly for every program.

11Prompt Recipe for Better Sequencing Results Outputs

XLSlides works best when the prompt includes the study type, audience, sequencing method, quality metrics, and decision need. A strong prompt is: `Create an executive genetic sequencing research results deck for a biotech R&D review. Audience: CSO, bioinformatics, clinical research, lab operations, investors, and scientific advisors. Include study objective, cohort design, sample summary, sequencing platform, methodology, QC metrics, bioinformatics pipeline, variant filtering logic, key findings, metric dashboard, limitations, validation plan, and next-step research roadmap.` Add details such as whole genome, exome, targeted panel, RNA-seq, single-cell, or long-read method; sample count; disease area; coverage targets; candidate genes; and known limitations. Ask for action-title headlines, compact metric cards, and clear distinction between confirmed findings and hypotheses. Specific prompts help XLSlides produce a rigorous research deck rather than a generic biotech presentation. Include validation status and intended research decision for reviewers and leadership. Mention the required confidence level and audience explicitly too, including assumptions.

12How XLSlides Speeds Up Sequencing Result Presentations

Sequencing result presentations are slow because the evidence lives across lab reports, pipeline outputs, QC files, variant tables, notebooks, cohort spreadsheets, and research notes. Teams often spend too much time converting technical outputs into slides and not enough time refining interpretation, limitations, and follow-up decisions. XLSlides helps create a structured first draft with sections for cohort context, methodology, quality control, pipeline logic, key findings, metric dashboard, limitations, validation, and roadmap. Researchers can refine scientific claims, bioinformatics teams can verify analysis details, lab operations can confirm QC metrics, and leadership can review resource decisions. This does not replace scientific review or statistical analysis, but it reduces presentation assembly work and gives the team a clear narrative framework. The result is a faster path from sequencing output to research decision, investor update, grant milestone, or collaboration discussion. Teams can reuse the structure for recurring readouts and milestone meetings across programs and cohorts.