Inventory Optimization Strategy Template

Stop wasting hours on manual formatting. Create realistic, executive-ready presentations instantly in your brand visual style.

Stock-out & buffer visualizations
SKU rationalization dashboards
Inventory reduction roadmaps

1What Is an Inventory Optimization Strategy Deck?

An inventory optimization strategy deck is the executive presentation used to explain how the organization will balance product availability, working capital, service level, and operating cost. It should diagnose whether the current problem is too much inventory, too little inventory, inventory in the wrong location, poor SKU mix, unreliable supply, forecast error, or weak replenishment rules. A good deck avoids treating inventory reduction as a blanket cost target. It shows where inventory creates value by protecting service and where it destroys value through obsolescence, carrying cost, markdowns, storage pressure, or cash trapped in slow-moving items. This template helps teams build a decision-ready story around root causes, policy changes, and measurable improvement. It is especially useful when finance wants cash release but operations needs to protect customer service. The best inventory strategy explains the tradeoff explicitly rather than hiding it in spreadsheet detail. It also clarifies which inventory pools require different actions.
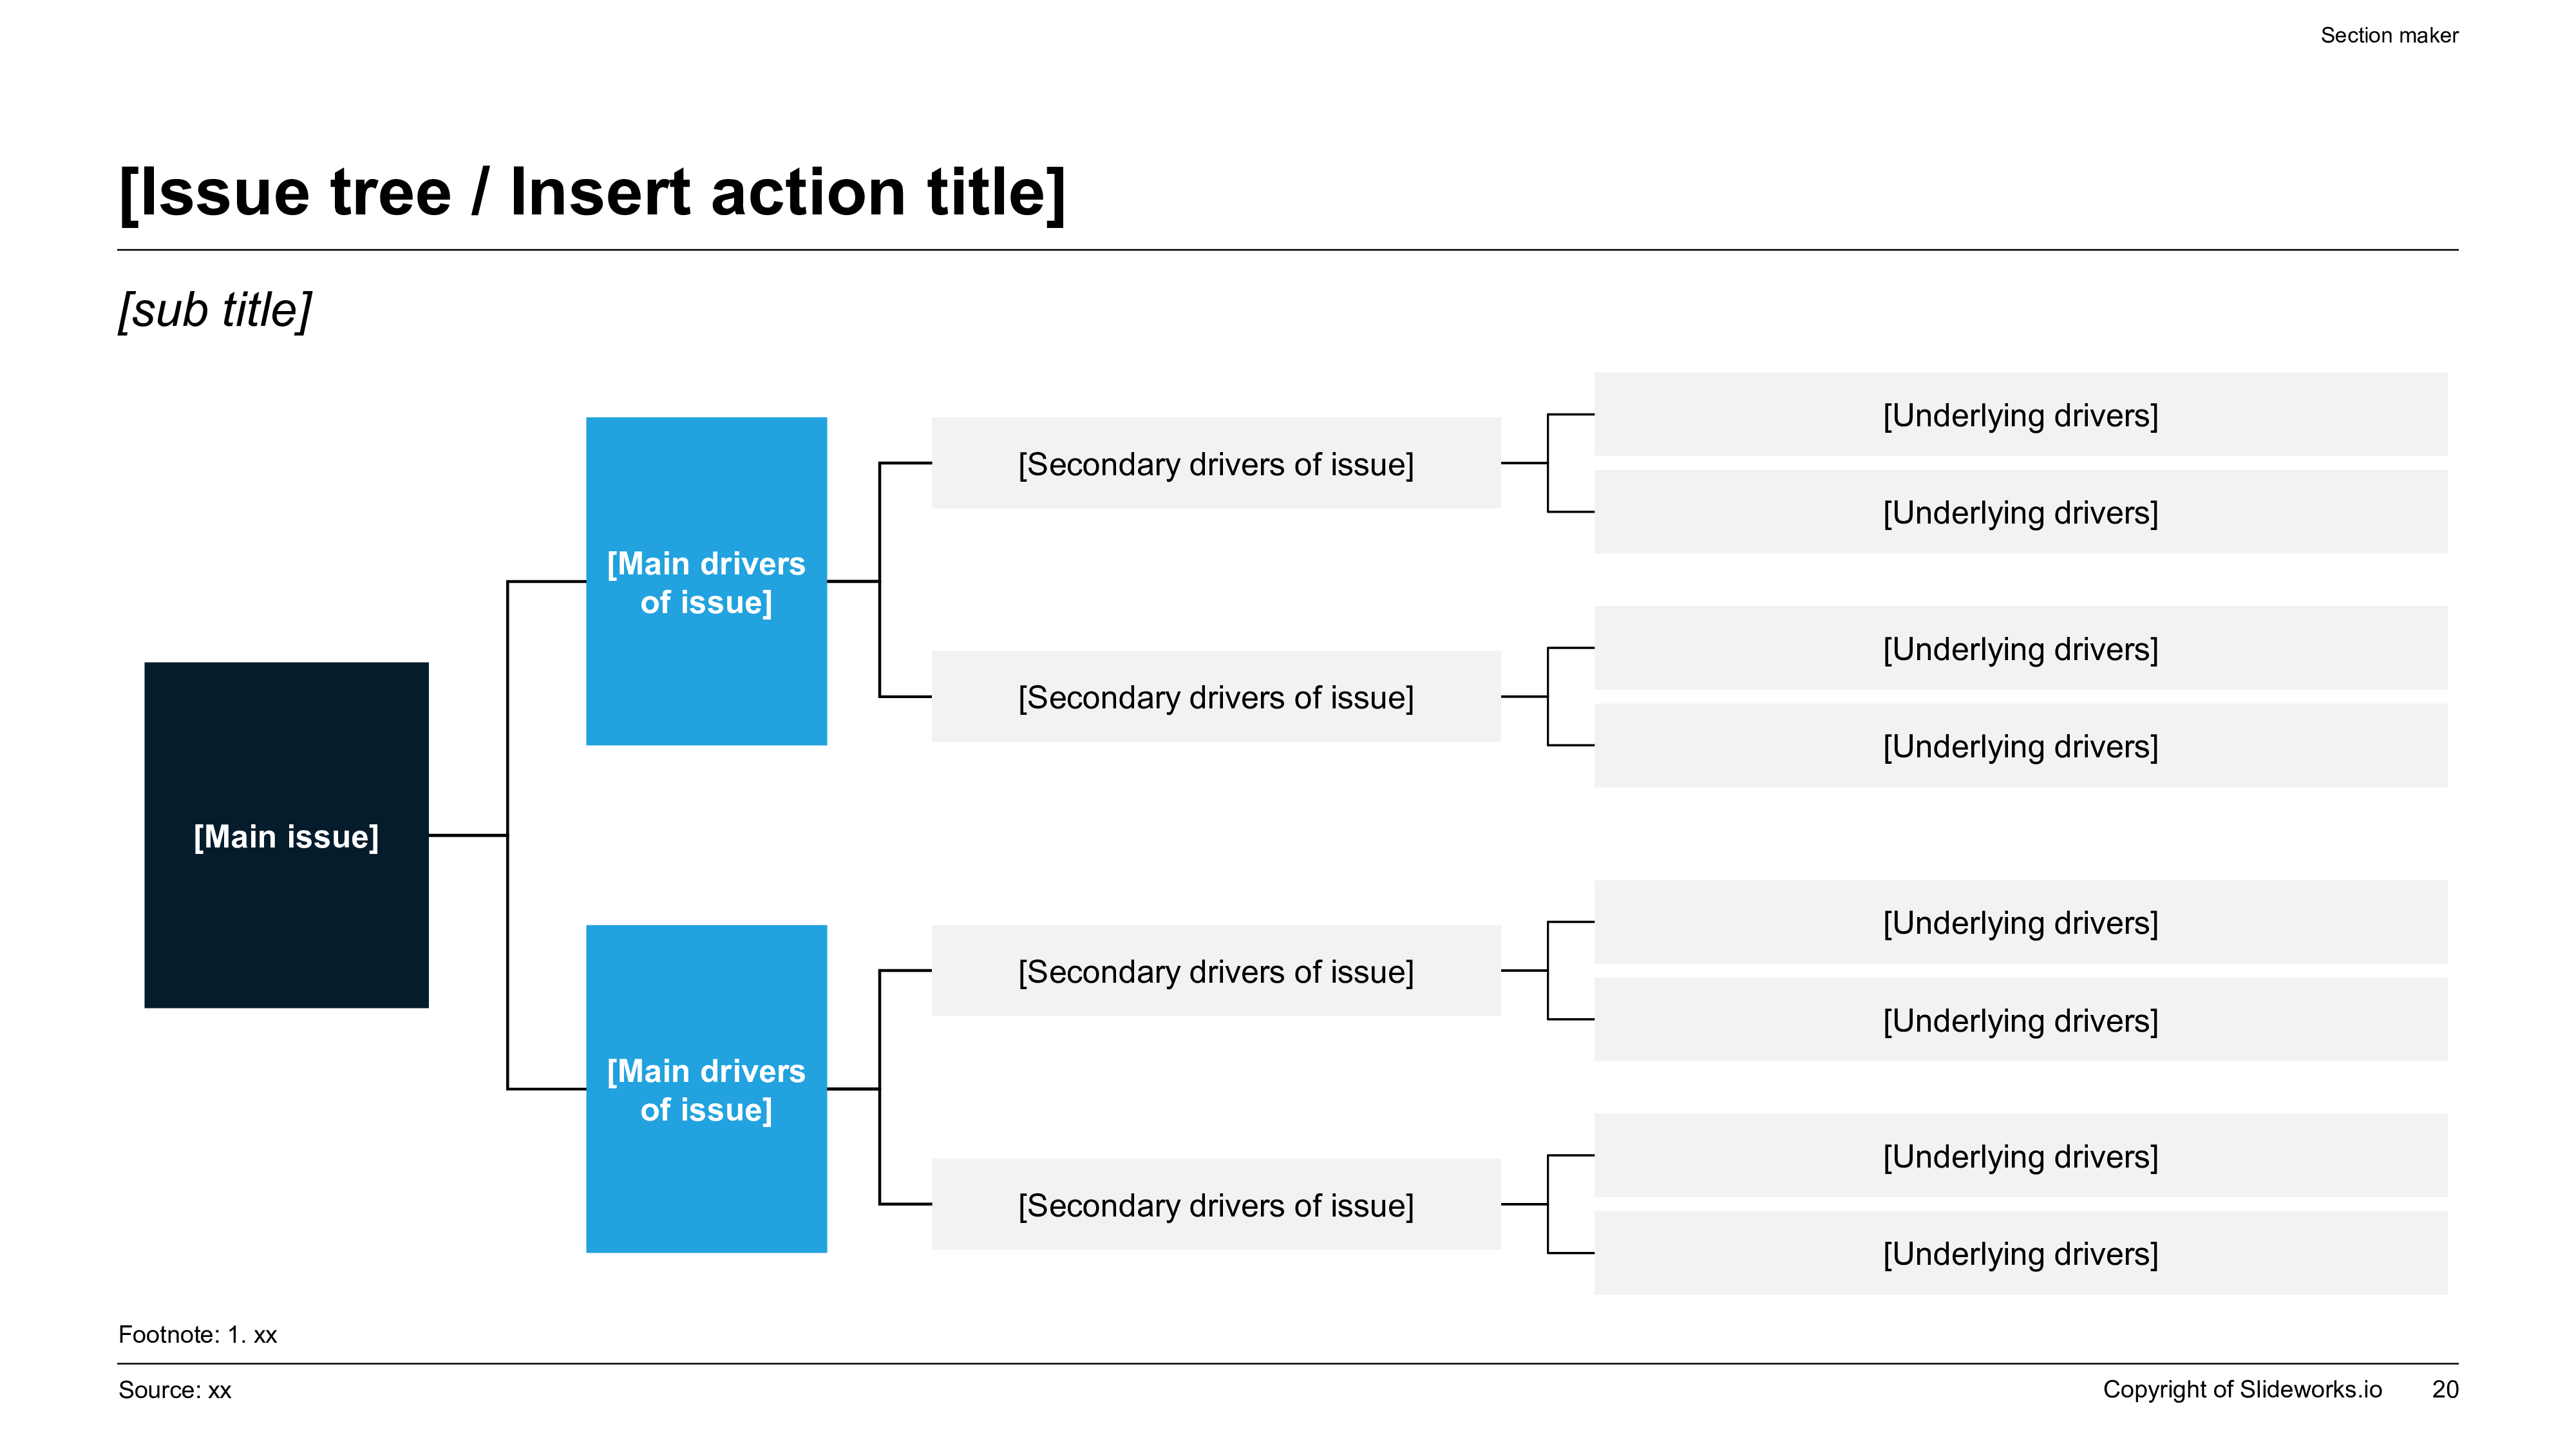
Inventory optimization issue tree slide with main issue, main drivers, secondary drivers, and underlying root-cause branches
Template Design LayoutInventory Optimization Strategy Template

2When to Use This Inventory Optimization Template

Use this template when leadership needs to decide how inventory should be reduced, rebalanced, or governed. Common triggers include frequent stockouts, high excess and obsolete inventory, poor forecast accuracy, low inventory turns, rising storage cost, weak on-time in-full performance, supply disruptions, SKU proliferation, or cash conversion pressure. It is also useful for S&OP redesign, post-merger inventory cleanup, retailer assortment reviews, manufacturing planning changes, spare parts optimization, or network redesign. The deck gives supply chain, finance, commercial, procurement, and operations teams a common structure for discussing the problem. Without that structure, inventory debates often become a conflict between service and cost. This template reframes the discussion around segmentation, root causes, policy choices, and execution roadmap. It helps executives decide where to release cash, where to increase buffers, and where process or data quality must improve before inventory targets become realistic. That makes the review more fact-based and less political. It also forces teams to name the customer-service risk before approving inventory actions.

3Recommended Inventory Strategy Deck Structure

A decision-ready inventory optimization presentation usually follows a ten-slide narrative. Start with the executive recommendation: which inventory pools should be reduced, protected, or rebalanced. Then show the current-state baseline, including inventory value, turns, service level, stockout rate, forecast error, aging, and location imbalance. Next, use an issue tree to diagnose the root causes behind excess or shortage. The middle of the deck should cover SKU segmentation, demand variability, safety stock policy, replenishment logic, supplier reliability, lead time, network constraints, and service-level tradeoffs. After that, present the financial value case and KPI dashboard, including working capital release, carrying cost, markdown risk, and service protection. Close with roadmap, owners, governance, and decisions required. This structure works because it prevents the conversation from jumping straight to inventory cuts before leadership understands what problem is being solved and what service risk is created. It keeps the narrative executive-ready. The sequence also helps finance, planning, and commercial leaders review the same facts.

4Using an Issue Tree for Inventory Root Causes

The suggested issue-tree image is well suited for inventory optimization because inventory problems often have multiple overlapping drivers. The main issue may be high inventory with poor service, and the primary branches might include demand uncertainty, supply variability, replenishment policy, SKU complexity, network placement, and governance. Secondary drivers can include forecast bias, promotion volatility, long supplier lead time, minimum order quantities, inaccurate master data, poor lifecycle management, and slow decision cadence. Underlying drivers may include specific process gaps such as missing phase-out rules, weak substitution logic, delayed purchase order updates, or inconsistent safety stock parameters. Presenting the diagnosis as a MECE issue tree helps executives see that inventory is not a single lever. It also prevents teams from over-focusing on one familiar explanation, such as forecast accuracy, when the real issue may be supplier variability, assortment complexity, or planning ownership. The issue tree turns symptoms into testable hypotheses. It should point to evidence, owners, and the next analytical step.

5SKU Segmentation and Service-Level Policy

Inventory optimization requires segmentation because not every SKU deserves the same service level, safety stock, or replenishment cadence. The deck should segment SKUs by demand value, margin, volatility, lifecycle stage, substitutability, supplier risk, customer importance, and strategic role. A high-margin fast mover with low substitutability may need stronger availability protection than a slow-moving low-margin item with alternatives. For retailers, segmentation may also include private label, seasonal products, promotional items, and long-tail assortment. For manufacturers, it may include raw materials, work-in-progress, finished goods, spare parts, and critical components. Once segments are defined, leadership can approve different policies for safety stock, reorder points, review cadence, and phase-out logic. This prevents blunt inventory cuts that damage service. It also helps finance understand why some inventory should be released aggressively while other buffers should be protected or even increased to prevent revenue loss. Segmentation makes inventory policy explainable. It also helps planners defend exceptions with data.

6Safety Stock, Reorder Points, and Planning Parameters

A strong inventory deck should explain planning parameters in business language rather than technical formulas alone. Safety stock, reorder points, order quantities, review frequency, and lead time assumptions determine whether inventory supports service or creates waste. The presentation should show which parameters are outdated, manually overridden, or inconsistent across products and locations. It should also explain whether buffers are based on actual demand variability, supplier reliability, service-level targets, and lead-time uncertainty. If minimum order quantities or container constraints force overbuying, that should be visible. If planners override system recommendations because master data is unreliable, that should be part of the diagnosis. Executives do not need every calculation, but they need to understand which policy choices drive working capital and availability. A parameter reset can release cash only if the underlying data, supplier behavior, and planning discipline are strong enough to support it. Include sample parameter changes for credibility. Show before-and-after policy logic where possible.

7Forecast Error, Demand Variability, and Supply Reliability

Inventory performance depends on both demand uncertainty and supply reliability. The deck should separate forecast error from supply-side instability because the corrective actions are different. Demand issues may include promotion spikes, seasonality, new product volatility, poor sales input, channel shifts, or weak statistical forecasting. Supply issues may include long lead times, late supplier confirmations, variable production yield, logistics delays, quality holds, or purchase order changes. If both are mixed together, teams may overbuild inventory without fixing the root cause. A good slide compares demand variability, forecast bias, supplier lead-time variance, and service outcomes by SKU segment or category. This helps leadership decide whether to invest in forecasting, supplier management, buffer policy, planning cadence, or network redesign. It also clarifies which assumptions should be reviewed in S&OP and which should be handled through operational exception management. This separation avoids generic fixes. It also shows whether buffers are compensating for preventable process failures.

8KPIs for Inventory Optimization Reviews

A credible inventory optimization dashboard should combine service, cash, and operational metrics. Core KPIs include inventory value, inventory turns, days inventory on hand, working capital, stockout rate, fill rate, on-time in-full, service level, forecast accuracy, forecast bias, excess and obsolete inventory, slow-moving inventory, aging, write-offs, carrying cost, supplier lead-time adherence, purchase order changes, and planner overrides. Finance stakeholders will focus on cash release, carrying cost, and write-down risk. Operations teams will focus on availability, expedite cost, and service stability. Commercial leaders will care about lost sales and customer impact. The deck should show baseline, target, owner, and measurement cadence for each major KPI. Avoid using inventory turns alone because it can improve while service deteriorates. A balanced dashboard makes tradeoffs explicit and ensures the program is managed as an operating improvement, not only a financial extraction exercise. Targets should be reviewed by segment, location, and product family regularly every month.

9Financial Value Case and Working-Capital Release

Inventory optimization initiatives need a clear financial value case that separates one-time cash release from recurring operating benefits. Cash release may come from reducing excess stock, lowering safety stock where risk is overstated, improving replenishment cadence, rationalizing SKUs, or selling down obsolete inventory. Recurring benefits may include lower carrying cost, reduced warehousing pressure, fewer markdowns, lower write-offs, less expedite freight, and better service-driven revenue protection. The deck should show which value is realistic, which assumptions are uncertain, and which actions are required to capture the benefit. For example, reducing inventory targets without changing supplier minimums or planning parameters may not release cash sustainably. Finance leaders should see the bridge from current inventory to target inventory by segment, product family, or location. That bridge should include risk notes so leadership understands where service could be affected and what mitigation is required. Separate committed savings from upside. Show timing because benefits may phase in gradually.

10Roadmap, Governance, and S&OP Integration

A good inventory optimization deck ends with a roadmap that connects analysis to operating cadence. The roadmap should sequence quick wins, policy resets, data cleanup, supplier actions, SKU rationalization, planning parameter changes, and system improvements. It should name owners across supply chain, finance, procurement, commercial, operations, and data teams. Governance matters because inventory targets are easy to set and hard to sustain. The deck should define how inventory decisions will be reviewed in S&OP or integrated business planning, which exceptions require escalation, how service-risk tradeoffs are approved, and how benefits are tracked. If commercial teams can add demand or promotions without planning alignment, buffers will rebuild. If procurement optimizes unit cost through large orders without inventory governance, excess will return. A sustainable roadmap therefore combines analytics, incentives, policy, and review cadence rather than relying on a one-time cleanup. Governance keeps the gains durable. It also prevents local overrides from recreating excess.

11Prompt Recipe for Better Inventory Strategy Outputs

XLSlides works best when the prompt includes the inventory problem, operating context, SKU segments, and decision audience. A strong prompt is: `Create an executive inventory optimization strategy deck for a multi-region manufacturer. Audience: CSCO, CFO, COO, demand planning, procurement, finance, and operations leaders. Include current inventory baseline, stockout and excess diagnostics, MECE issue tree root-cause analysis, SKU segmentation, safety stock and reorder point logic, supplier lead-time reliability, forecast error analysis, working-capital release bridge, service-level KPI dashboard, governance model, and 90-day implementation roadmap.` Add specific details such as product categories, regions, warehouse network, supplier constraints, MOQ rules, service targets, and known data issues. Ask for action-title headlines, issue-tree logic, KPI dashboards, and roadmap slides. Clear prompts help XLSlides create a board-ready inventory strategy rather than a generic cost-reduction deck. Include baseline inventory value and target service levels. Name the planning system, warehouse scope, and main SKU categories clearly upfront for reviewers.

12How XLSlides Speeds Up Inventory Optimization Work

Inventory optimization work is slow because the evidence sits across ERP extracts, demand plans, warehouse reports, supplier data, finance models, SKU lists, and planner notes. Teams often spend hours turning analysis into slides before they can debate the actual tradeoffs. XLSlides helps create a structured first draft with sections for inventory baseline, issue-tree diagnosis, SKU segmentation, planning parameters, forecast and supply variability, KPI dashboard, financial value case, and implementation roadmap. Supply chain leaders can refine the operating recommendations, finance can test the working-capital bridge, procurement can validate supplier constraints, and commercial teams can review service implications. This does not replace detailed data analysis, but it removes presentation assembly friction and gives the team a decision-ready narrative. The result is faster alignment on where to reduce inventory, where to protect buffers, and how to sustain service while freeing cash. Teams can reuse the format monthly for operating reviews and governance checkpoints.