think-cell for Claude: How Claude Now Builds Genuine think-cell Charts in PowerPoint
Quick answer
think-cell for Claude lets Claude for PowerPoint (and Claude Code) create genuine think-cell charts: the XLSlides connector relays Claude's request to a small helper on your Windows PC, which drives your own think-cell to insert, size, place and annotate the chart. Your deck stays on your PC and chart data is never stored by XLSlides. It needs Windows, desktop PowerPoint, your own think-cell licence, a Claude plan with Claude for PowerPoint and an XLSlides Starter, Pro or Team plan.

If you build consulting or finance decks, you probably have two habits that never met. You ask Claude to draft the story, and you open think-cell to build the charts, because nothing else gives you a proper waterfall, a Mekko or a CAGR arrow that partners and clients recognise.
Until now, asking Claude for a chart got you a native PowerPoint chart or a set of drawn shapes. It looked like a chart, but it was not think-cell: no datasheet, no think-cell handles, no arrows that recalculate.
think-cell for Claude closes that gap. You type "add a waterfall for EBIT with a difference arrow" in Claude for PowerPoint, and the think-cell installed on your own PC builds a genuine think-cell chart in the deck you have open. This guide explains how it works, what it can and cannot do, how to set it up in about two minutes, and what happens to your data.
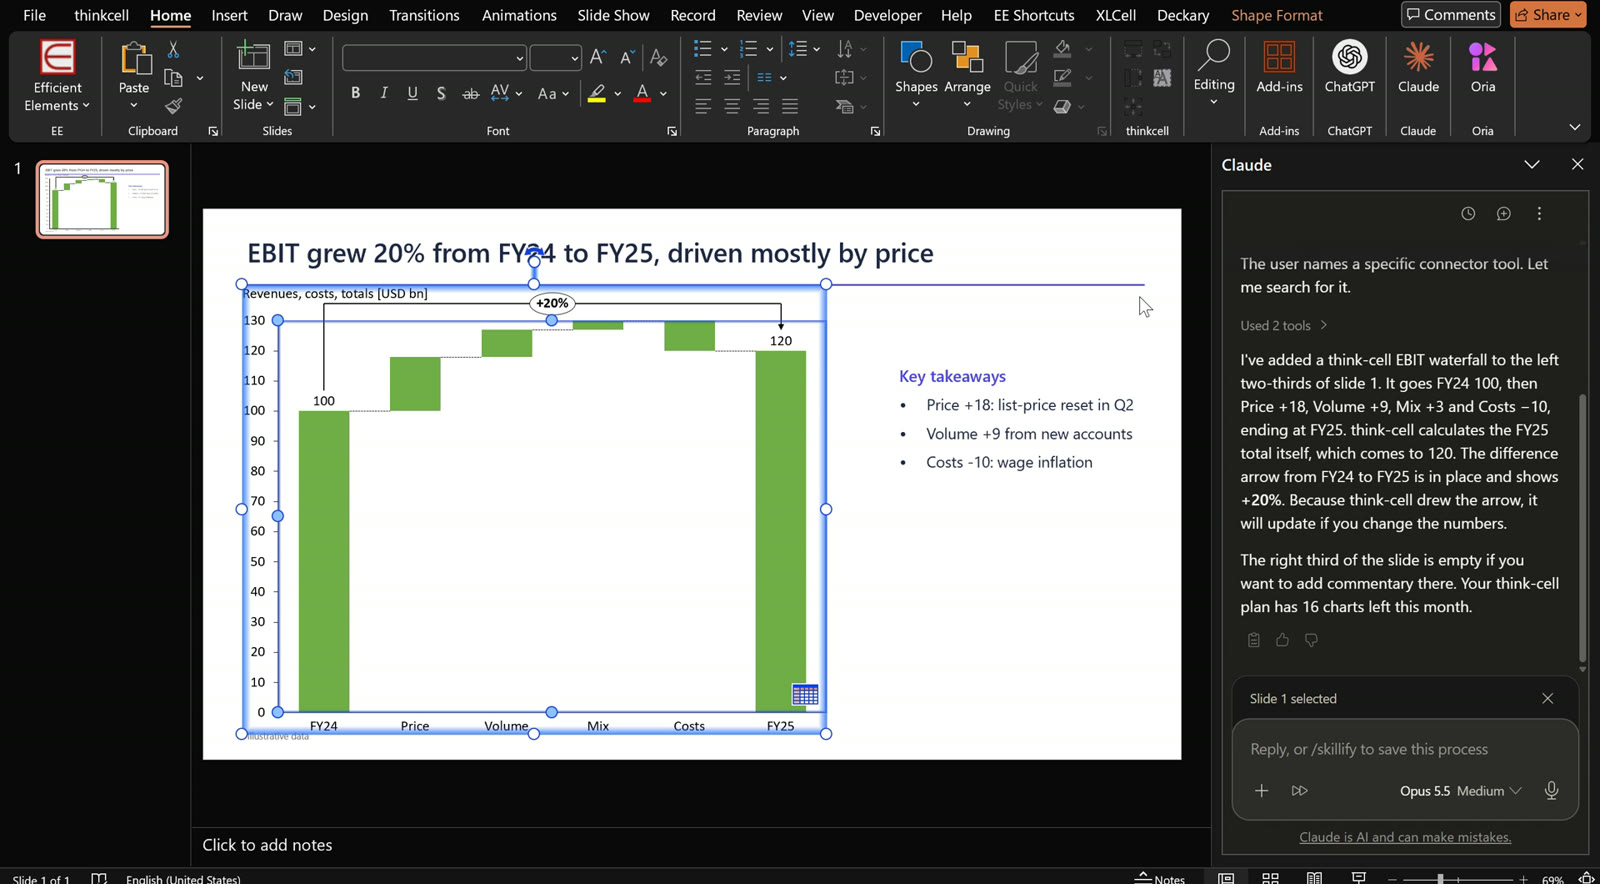
A real screenshot, not a mock-up: Claude for PowerPoint asked the XLSlides connector for an EBIT waterfall with a difference arrow, and think-cell built it on the left two-thirds of the slide.
Can Claude use think-cell?
Not on its own. Claude for PowerPoint makes native PowerPoint charts, and it has no way to open think-cell's chart menu or datasheet. Claude can use think-cell once it has a tool that drives think-cell for it, and that is what think-cell for Claude adds: an MCP server for think-cell (the XLSlides connector) plus a helper on your PC. With both in place, Claude can create, update and annotate think-cell charts from Claude for PowerPoint or from Claude Code.
What think-cell for Claude is
think-cell for Claude is a bridge between Claude and the think-cell on your Windows PC. It has three parts:
| Part | What it is | Where it runs |
|---|---|---|
| XLSlides connector | A personal MCP connector you add to your Claude account. It gives Claude chart tools: place a chart, update its numbers, add arrows, read the deck, delete a chart. | XLSlides server (relays requests, stores no chart data) |
| XLSlides helper | A small Windows tray app that receives those requests and drives PowerPoint, Excel and think-cell for you. | Your PC |
| think-cell skill | A short skill file that tells Claude when to use think-cell instead of drawing a native chart. | Your Claude account |
The important part: the chart is built by your own think-cell, under your own licence, inside your own PowerPoint. XLSlides does not draw an imitation. When you click the chart afterwards, think-cell's toolbar, datasheet and handles all work exactly as if you had built it by hand.
Watch the setup (under 1½ minutes)
The video below walks through the whole setup on the real screens, from downloading the helper to the first chart.
How it works, step by step
Here is what happens between your prompt and the finished chart:
- You ask Claude. In Claude for PowerPoint you type something like: "Use the XLSlides think-cell connector to add a think-cell waterfall for EBIT on the left two-thirds of this slide: FY24 100, Price +18, Volume +9, Mix +3, Costs -10, FY25 total, with a difference arrow from FY24 to FY25."
- Claude calls the connector. Claude turns your request into a structured call: chart type, categories, values, where on the slide it should go, and which arrows to add. The first time, Claude asks your permission to use the tool (Allow once or Always allow).
- The connector relays the call to your PC. The XLSlides server passes the request to the helper that is paired with your account. It does not keep the numbers.
- The helper drives think-cell. On your PC, the helper inserts a think-cell chart, fills its datasheet, sizes it and places it on the slide, and adds think-cell's own arrows.
- Claude reports back. The helper tells Claude what it built (for example, which arrow shows +20%), and Claude summarises it for you in the chat.
In our recorded run, the whole thing took about two minutes from prompt to finished chart, of which roughly 50 seconds was think-cell building the chart.
It really is automatic
People who watch the recording often ask whether someone is moving the mouse off-camera. Nobody is. The helper uses think-cell's own on-slide handles and menus, the same way a person would, so you will see the pointer move inside PowerPoint while a chart is being placed.
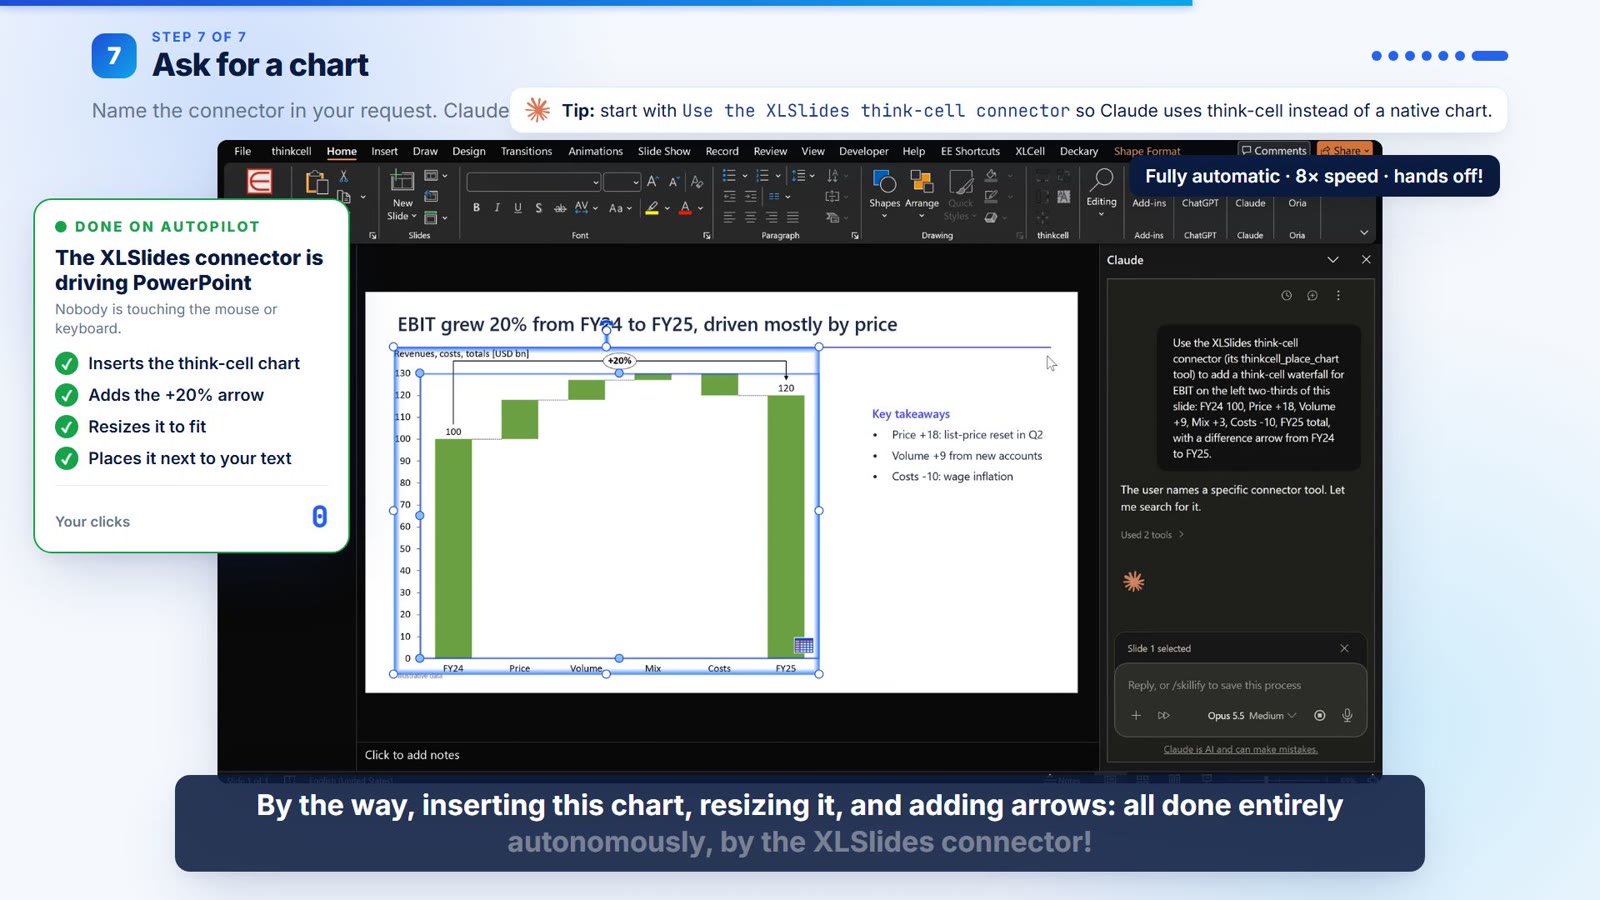
What the connector does by itself:
- Inserts the chart from think-cell's own chart library, so it is a real think-cell element.
- Fills the datasheet with your categories, series and values.
- Sizes and positions it in the area you asked for, next to your existing slide content.
- Adds think-cell arrows: CAGR, level difference and total difference arrows, drawn by think-cell so they recalculate.
- Updates numbers later ("make Volume -8") in place, without moving the mouse.
Keep your hands off the mouse and keyboard while a chart is being placed (about 30 to 90 seconds per chart). If you click elsewhere halfway through, the helper can lose its place. The tray icon shows "Working" while it runs, and Claude tells you before it starts. Changing numbers on an existing chart is instant and does not need the mouse.
What you can make
The connector covers the consulting chart set:
| Chart family | Types |
|---|---|
| Bridges | Waterfall (build-up and build-down) |
| Columns | Stacked, 100% stacked, clustered, combo |
| Bars and lines | Bar, line, area |
| Market maps | Mekko / Marimekko (by percentage or by units) |
| Parts of a whole | Pie, doughnut |
| Relationships | Scatter, bubble |
On top of the chart itself, Claude can ask think-cell for:
- CAGR arrows between any two categories ("+12% p.a.").
- Level difference arrows that compare two bars at the side of the chart.
- Total difference arrows that bracket two bars over the chart.
- Series connector lines between neighbouring columns.
You can put several charts on one slide, at any position and size, and mix chart types freely.
Set it up in six steps
You need to do this once per PC. The setup page walks you through it with your personal links.
1. Download the helper
Open your XLSlides account, go to think-cell for Claude, and click Download for Windows. Because the helper is new, your browser or Windows SmartScreen may warn that the file is not commonly downloaded. In Edge choose Keep; if Windows shows "Windows protected your PC", click More info, then Run anyway.
2. Install it
Click through Next, Next, Install, Finish. The helper installs just for you, without administrator rights, and starts in the system tray.
3. Connect your PC
On the setup page, click Get a pairing code and type the code into the helper window. The page switches to Connected and shows your PC.
4. Add the connector to Claude
Click Create my connector URL on the setup page and copy it. It works like a password, so keep it private. In Claude go to Customize → Connectors → + Add → Add custom connector, name it XLSlides think-cell, paste the URL as the MCP server URL and click Continue. No sign-in is needed: the URL is the key.
5. Add the think-cell skill
Download the skill (.zip) from the setup page. In Claude go to Customize → Skills → + Add → Upload skill and upload the zip as it is, without unzipping it. The skill teaches Claude to reach for think-cell whenever you ask for a consulting-style chart.
6. Switch it on in PowerPoint
Open PowerPoint, open the Claude panel, then + → Connectors and switch on XLSlides think-cell. You are ready.
How to prompt for the best results
Claude for PowerPoint has its own built-in way of making charts, so name the connector in your request. Start with "Use the XLSlides think-cell connector to…" and Claude will use think-cell instead of drawing a native chart.
Prompts that work well:
- "Use the XLSlides think-cell connector to add a waterfall for EBIT on the left half of this slide: FY24 100, Price +18, Volume +9, Costs -10, FY25 total."
- "Add a stacked column chart of revenue by region for 2021 to 2025 with a CAGR arrow from 2021 to 2025."
- "Make a Mekko of market share by region: column widths are market size, segments are our share and competitors'."
- "Change Price to +22 in the EBIT waterfall."
- "Add a level difference arrow between FY24 and FY25."
Tips:
- Give the numbers and the layout in one go: chart type, categories, values, where on the slide, and which arrows.
- Say where it goes ("left two-thirds", "top right", "full width below the headline") so the chart sits next to your existing text.
- Size and position are set when the chart is placed. To resize it later, drag it in think-cell like any chart, or ask Claude to place a new one.
- Edits are cheap. Changing numbers, adding arrows and deleting charts do not count towards your monthly chart allowance.
The connector also appears in Claude Code when you are signed in with the same Claude account, so you can build charts from a terminal. They land in the PowerPoint deck that is open on the PC running the helper.
Your data: what goes where
Security reviews always ask the same question: does my deck go to a third party? Here is the honest answer.

| Data | Where it goes | Stored by XLSlides? |
|---|---|---|
| Your PowerPoint deck | Stays on your PC. The helper edits it in place. | No. It is never uploaded. |
| Chart numbers and labels | Passed from Claude through the XLSlides connector to the helper on your PC. | No. Relayed only, never stored. |
| Slide details the helper sends back (slide size, existing shapes) | Passed from your PC back to Claude so it can place the chart. | No. Relayed only, never stored. |
| Usage log | Which action ran, whether it worked, an error code if not, how long it took, and the helper version. | Yes, to count your monthly charts and fix problems. |
| Paired PC | The PC name, helper version, last connection time and a hashed device key. | Yes, so the connector knows which PC to send charts to. |
| Helper log and failure screenshots | Kept on your PC for troubleshooting. | No. Never uploaded. |
Two things to keep in mind:
- Claude itself sees your prompt, as it does for anything you type into Claude. That part is covered by your Claude plan and Anthropic's terms, not by XLSlides.
- The helper only acts when Claude asks it to. It controls PowerPoint, Excel and think-cell and does not read other files or apps.
The full details are in section 5 of the XLSlides privacy policy.
Requirements and pricing
| You need | Details |
|---|---|
| Windows PC | Windows 10 or 11 with desktop PowerPoint and Excel |
| think-cell | Installed, with your own licence (XLSlides does not include or resell think-cell) |
| Claude | Pro, Max, Team or Enterprise, with Claude for PowerPoint |
| XLSlides | Starter, Pro or Team plan |
think-cell for Claude is included in the paid XLSlides plans:
| XLSlides plan | New think-cell charts per month |
|---|---|
| Starter | 20 |
| Pro | 75 |
| Team | 300 |
Only new charts count. Updating numbers, adding arrows and deleting charts are free, and you keep everything else in the plan: AI deck generation, templates and exports. See pricing.
Limitations to know before you start
We would rather you know these up front:
- Windows only. think-cell's automation runs on Windows desktop PowerPoint. Mac and PowerPoint on the web are not supported yet.
- The mouse moves while a chart is placed. Plan for 30 to 90 seconds of hands-off time per new chart.
- Name the connector in Claude for PowerPoint. Without it, Claude may fall back to a native PowerPoint chart.
- Resizing happens at placement. After that, resize by dragging in think-cell or place a new chart.
- Gantt charts are not offered yet. They are held back until they render correctly.
- It is in early access. The helper is new, so Windows may warn you about it on download until it builds a reputation.
Claude's native charts vs think-cell vs think-cell for Claude
| Claude's own charts | think-cell by hand | think-cell for Claude | |
|---|---|---|---|
| Chart engine | Native PowerPoint chart or shapes | think-cell | think-cell |
| Waterfall, Mekko, CAGR arrows | Approximated | Yes | Yes |
| Editable in think-cell's datasheet | No | Yes | Yes |
| Arrows recalculate when numbers change | No | Yes | Yes |
| Time to first chart | Seconds | Several minutes of clicking | About 2 minutes, hands-free |
| Change numbers by asking in plain English | Yes | No | Yes |
If your firm already standardises on think-cell, the right-hand column is the one that lets you keep that standard while letting Claude do the building.
think-cell for Claude vs thinkcell Assist
think-cell (which now styles its name thinkcell) has its own AI feature, thinkcell Assist: an AI chat inside PowerPoint and Excel that comes with its AI Suite packages and was in early access at the time of writing. If you search for "think-cell AI", that is usually what you will find. The two take different routes to AI-made think-cell charts:
| thinkcell Assist | think-cell for Claude | |
|---|---|---|
| Made by | think-cell | XLSlides (independent) |
| The AI you talk to | Assist's built-in chat (think-cell does not name the model) | Claude, in Claude for PowerPoint or Claude Code |
| think-cell you need | A thinkcell AI Suite package | The think-cell already installed on your PC |
| Also needed | Nothing else | A Claude plan and an XLSlides Starter, Pro or Team plan |
| A good fit if | You want think-cell's own AI, including its built-in data sources | Your team already works in Claude and wants it to build the think-cell charts |
Check thinkcell.com for Assist's current features and pricing.
Get started
- Pick a Starter, Pro or Team plan.
- Open the think-cell for Claude setup page.
- Follow the six steps above. The first chart takes about two minutes.
Read more on the think-cell for Claude product page.
think-cell is a trademark of think-cell Software GmbH. XLSlides is an independent product and is not affiliated with, endorsed or sponsored by think-cell Software GmbH or Anthropic. Claude is a product of Anthropic.
FAQs
Can Claude create think-cell charts?+
Yes, with the XLSlides connector. Claude sends the chart request to the XLSlides helper on your Windows PC, and your own think-cell builds a genuine think-cell chart in the deck you have open, with its datasheet, handles and arrows.
Is there a think-cell MCP server for Claude?+
think-cell does not publish one. The XLSlides connector is an MCP server that gives Claude think-cell tools (place a chart, update its numbers, add arrows, read the deck, delete a chart) and passes each call to the XLSlides helper on your PC, which drives your own think-cell. It works in Claude for PowerPoint and Claude Code.
Is think-cell for Claude the same as thinkcell Assist?+
No. thinkcell Assist is think-cell's own AI chat, part of its AI Suite packages. think-cell for Claude is an independent XLSlides product that lets Claude, which you may already use, drive the think-cell installed on your PC. You chat with Claude instead of a separate assistant.
Do I need my own think-cell licence?+
Yes. The charts are built by the think-cell installed on your PC, under your licence. XLSlides does not include or resell think-cell.
Does my PowerPoint deck get uploaded to XLSlides?+
No. The deck stays on your PC and the helper edits it in place. Chart numbers pass through the XLSlides connector on the way to your PC and are never stored; XLSlides only logs which action ran, whether it worked and how long it took.
Why does the mouse move while Claude places a chart?+
think-cell sizes and annotates charts with its on-slide handles and menus, and the XLSlides helper uses them automatically, like a person would. Keep your hands off the mouse and keyboard for about 30 to 90 seconds per new chart. Changing numbers later needs no mouse.
Does think-cell for Claude work on a Mac?+
Not yet. think-cell automation is Windows-only, so the helper needs Windows 10 or 11 with desktop PowerPoint and Excel.
Why did Claude make a normal PowerPoint chart instead of a think-cell chart?+
Claude for PowerPoint has its own chart feature. Start your request with "Use the XLSlides think-cell connector to..." and make sure the connector is switched on in the Claude panel, and Claude will use think-cell.
How many think-cell charts can I make?+
XLSlides Starter includes 20 new think-cell charts a month, Pro 75 and Team 300. Updating numbers, adding arrows and deleting charts do not count.