Professional Target Operating Model (TOM) & Org Design Templates

Stop wasting hours on manual formatting. Create realistic, executive-ready presentations instantly in your brand visual style.

Widescreen org-chart visualizations
Governance process flow re-design
Technology enablement roadmaps

1The Strategic Alignment of Target Operating Model to Corporate Vision

In an era of rapid technological disruption and shifting market conditions, a company's organizational structure must directly align with its strategic goals. A Target Operating Model (TOM) acts as the operational blueprint that translates corporate strategy into execution capabilities. It defines how a company will configure its resources, processes, technology, governance structures, and talent pools to deliver value to customers. Strategy leads and corporate development partners must construct a rigorous TOM to prevent organizational silos, operational redundancies, and strategic drift. Presenting a TOM proposal to the executive committee or board of directors requires a highly structured, boardroom-ready deck that outlines transition pathways, capability maps, and resource allocations. Using professional McKinsey-style templates ensures that senior stakeholders can quickly comprehend the organizational changes, process integrations, and technology requirements, building the necessary executive alignment to fund and execute the transformation project. Additionally, a well-defined Target Operating Model facilitates strategic portfolio management, enabling corporate finance partners to evaluate how operational investments affect long-term capability development. By linking operational changes to specific organizational performance milestones, transformation leads can successfully secure executive sponsorship, align regional management teams, and ensure that the business realizes the full strategic value of its operating model investments.
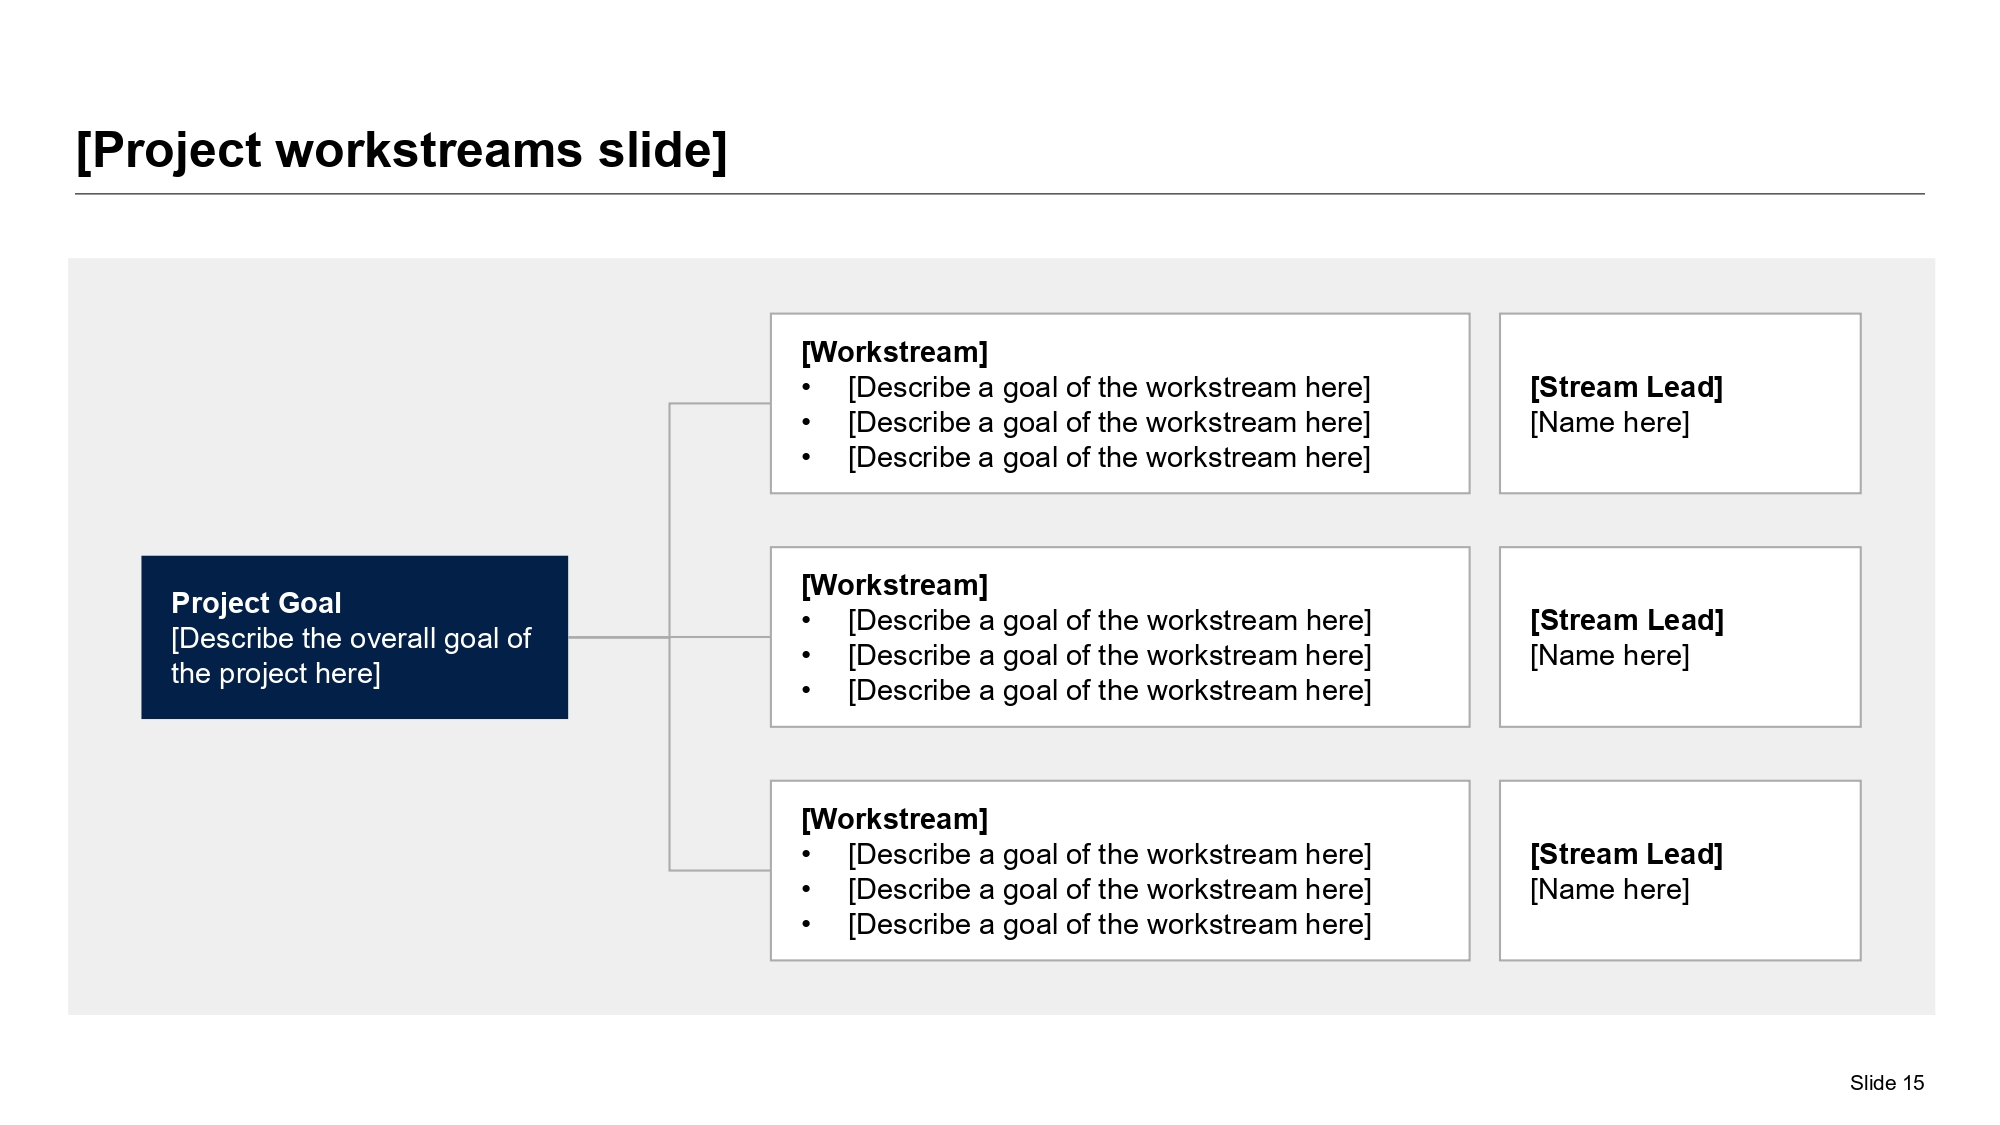
A premium organizational governance flowchart slide showing a branching workstream tree originating from a central anchor goal and splitting into designated ownership blocks.
Template Design LayoutProfessional Target Operating Model (TOM) & Org Design Templates

2The Six Structural Layers of a Target Operating Model Blueprint

A comprehensive Target Operating Model is built upon six distinct, mutually exclusive, and collectively exhaustive (MECE) layers that define the future state of the enterprise. First, the Process Layer maps out the end-to-end workflows and operational pathways that drive business efficiency. Second, the People Layer defines reporting structures, role descriptions, and talent capabilities. Third, the Technology Layer identifies the software systems, APIs, and cloud infrastructure required to support process automation. Fourth, the Governance Layer establishes decision-making rights, authority limits, and steering committees. Fifth, the Location Layer determines regional hub strategies, co-location benefits, and remote work policies. Finally, the Data Layer standardizes information flow, analytics engines, and compliance safeguards across all departments. Mapping these layers onto a structured presentation slide helps transformation leads communicate a balanced organizational change strategy, ensuring that technology investments are fully integrated with talent development and process optimization. By establishing a clear operating model blueprint across these six integrated dimensions, business transformation leads can construct a coherent organizational design that minimizes transition friction, accelerates time-to-market, and guarantees that every corporate function is fully optimized to support the long-term growth objectives of the modern global enterprise.

3Designing MECE Organizational Structures to Eliminate Silos

A frequent cause of organizational friction is overlapping authority and redundant roles across business units. Organizational designers must apply the MECE (Mutually Exclusive, Collectively Exhaustive) principle to reporting structures, ensuring that every function has a clear, non-overlapping scope of responsibility. In a MECE org tree, functions are categorized cleanly by client segment, product line, or geographic region, with zero double-counting of headcount or duplicate leadership roles. This structural discipline eliminates cost inefficiencies and prevents decision paralysis. When presenting an organizational redesign proposal, strategy leads must utilize a clean, hierarchical org chart template that visualizes reporting relationships, role scopes, and key leadership interfaces. Keeping at least thirty percent negative space on these slides is critical to prevent visual clutter, allowing executive board members to easily trace reporting channels and verify that organizational spans of control are balanced and optimized for agility. Ultimately, this structural discipline creates a highly agile organization that can respond rapidly to changing market conditions. By maintaining a clean, clutter-free visual representation of your org design on widescreen slides, project leaders can successfully align senior executives, demonstrate operational discipline, and build organizational trust across all business units.

4Mapping Business Capabilities to Drive Operating Model Decisions

Strategy leads must define which organizational capabilities are core competitive differentiators and which are generic administrative tasks. Capability mapping categorizes corporate functions based on strategic impact, allowing management to prioritize transformation capital. Core capabilities—such as proprietary software development, brand marketing, or customer service—require high investment and strict internal governance. Generic capabilities—such as payroll processing, infrastructure maintenance, or basic IT support—can be outsourced to third-party vendors or centralized in shared services hubs. Presenting a capability maturity assessment using a clean visual grid helps steering committees identify operational gaps. The grid scores capabilities from level one (ad-hoc, manual processes) to level five (fully automated, continuously optimized workflows), providing a clear baseline for technology enablement roadmaps. Mapping this strategic analysis shows board members that the proposed target operating model is driven by data-driven capital allocation. This structured classification ensures that capital is deployed where it delivers the highest strategic return, rather than being diluted across transactional back-office functions. Mapping these capability levels on a clear visual grid provides a quantitative foundation for organizational design, proving to stakeholders that the operating model transformation is backed by analytical rigor and strategic planning.

5Clarifying Decision Rights and Process Ownership via RACI

A Target Operating Model cannot function without clear decision rights and accountability boundaries. Operations leads must define who is Responsible, Accountable, Consulted, and Informed for every core business process. The RACI framework is a standard tool used to eliminate role confusion and accelerate decision-making speed during corporate restructuring. Visualizing this decision matrix in a high-density, clean tabular format helps stakeholders understand process governance. The table below represents a standard operating model RACI calibration map:

Operational ProcessResponsible (R)Accountable (A)Consulted (C)Informed (I)
Org Chart RedesignHR DirectorChief Operating OfficerStrategy LeadBusiness Unit VP
Systems IntegrationIT ArchitectChief Information OfficerVendor PartnerSecurity Lead
SLA Performance ReviewOperations ManagerShared Services DirectorClient LeadSteering Committee
Budget ReallocationFinance PartnerChief Financial OfficerBusiness Unit VPAudit Lead

By formalizing these roles, transformation teams prevent execution delays, establish clear process ownership, and build organizational confidence.

6Planning the Phased Technology Integration for TOM Rollouts

A target operating model cannot achieve its operational efficiency targets without modern technology enablement. System architects and transformation leads must design a phased integration roadmap that synchronizes software rollouts, database migrations, and cloud consolidations with organizational restructuring. This technology roadmap must define critical dependencies, such as standardizing customer CRM software databases before consolidating regional sales teams. Outlining these dependencies on a structured, widescreen timeline slide helps stakeholders visualize the sequence of key milestones. The checklist below summarizes the critical execution phases for tech enablement:

  • Phase 1: Architecture Review** - Audit legacy software systems, document API dependencies, and design target state data models.
  • Phase 2: Platform Integration** - Deploy core enterprise software systems, configure databases, and establish security protocols.
  • Phase 3: Operational Hand-off** - Train end-users, migrate transactional data, and decommission legacy software platforms.

By following this structured roadmap, organizations minimize integration downtime and protect business continuity. This systematic technology enablement framework ensures that IT investments are directly tied to organizational milestones. Strategy leads can present this phased timeline to the steering committee, demonstrating how software standardization directly supports new role designs, service delivery models, and overall business transformation goals.

7Visual Standards and Typography Rules for TOM Slide Decks

To ensure the executive board focuses on the strategic merits of your organizational design, your slides must adhere to strict visual rules. The 'mckinsey-blue' design theme uses a light-grey canvas and deep navy accents to project analytical quality and professionalism. Presenters must maintain a disciplined 60-30-10 color distribution: a 60% dominant background canvas prevents visual clutter, a 30% structured layout grid (using slate-blue card containers) groups org charts or process tables, and a 10% high-contrast accent key (such as deep royal blue) highlights key leadership changes or roadmap milestones. All text containers, metrics cards, and graphics must align perfectly to a 12-column visual grid, avoiding layout drift. Furthermore, keep typography disciplined: limit the deck to exactly two font families, keeping slide headings at 24pt-28pt, subheadings at 16pt-18pt, and body text at 12pt-14pt. Protecting at least 30% negative space on every slide lets the content breathe, reducing cognitive friction. By enforcing these design constraints, presentation decks retain a boardroom-ready look and feel. Project leaders can ensure that the visual layout reinforces the professional caliber of their operational strategies, minimizing audience distraction and focusing key decision-makers on critical operating model recommendations and governance pathways.

8Mitigating Transition Risks in Target Operating Model Transitions

Redesigning a target operating model introduces significant transition risks, including employee anxiety, productivity loss, and key talent attrition. Business transformation leaders must manage these risks by constructing a clear change management plan. This strategy must outline employee training schedules, leadership alignment workshops, and transparent communications. Transformation leads must monitor transition indicators—such as employee engagement scores, project milestone completion rates, and customer service satisfaction—to identify change resistance early. Presenting a risk assessment matrix alongside your operating model proposal shows stakeholders that you have planned for operational contingencies. Highlighting key mitigation actions, like establishing peer mentorship programs during hub migrations, reassures the board of directors that transition risks are actively managed. This proactive risk mitigation plan is essential to safeguard business continuity, maintain stakeholder confidence, and ensure that the organization realizes the projected efficiency gains and operational synergies of the new structure. Furthermore, establishing open feedback channels and peer-to-peer learning networks during the rollout phase helps mitigate employee anxiety and build a collaborative culture. This proactive change management blueprint demonstrates to executive board members that organizational risks are actively identified, managed, and mitigated throughout the transformation lifecycle.

9Five Critical Errors to Avoid in Org Design Slide Layouts

To ensure your operating model proposal passes executive committee scrutiny and secures implementation approval, teams must avoid five common presentation mistakes:

  • Overcomplicating the Chart**: Cramming complex, multi-layered org trees onto a single slide; keep at least thirty percent negative space to focus attention on key reporting lines.
  • Failing to Define Decision Rights**: Presenting reporting changes without clarifying who has final decision authority, leading to role confusion.
  • Non-Widescreen Formatting**: Presenting organizational designs in legacy 4:3 formats which distort shapes and text on modern boardroom displays.
  • Poor Contrast**: Using light-grey text on white backgrounds, which washes out on older boardroom projectors; high-contrast coloring is mandatory.
  • Lacking a Phased Roadmap**: Proposing a massive organizational shift overnight without outlining transition steps, making the plan look high-risk.

Avoiding these common mistakes ensures your operating model proposal retains executive focus, communicates operational discipline, and builds strategic trust. Adhering to these slide layout rules ensures that your organizational redesign proposal looks professional and polished. By avoiding these common design errors, transformation teams can present a compelling, data-driven narrative that builds strategic alignment, secures capital approval, and drives successful operating model transitions.

10Formulating the Target Operating Model Slide Generation Prompt

Creating a comprehensive organizational structure or operating model presentation manually in PowerPoint is a slow, frustrating task that often consumes ten to fifteen hours of adjusting margins, aligning boxes, and drawing connector lines. This administrative overhead drains valuable cognitive energy that strategy and transformation teams should instead spend analyzing processes, aligning leaders, and designing roles. XLSlides AI automates this layout design process, allowing strategy leads to compile premium, boardroom-ready operating model decks in under sixty seconds. The AI performs context-aware layout matching, interpreting your organizational brief and automatically mapping data to hierarchical org trees, governance flowcharts, or transition roadmaps. Brand consistency is strictly maintained based on your chosen design preset, preventing font or margin drift. The final presentation exports as standard, editable PowerPoint vector shapes, allowing you to easily adjust roles, update reporting lines, or customize slides for specific committees, providing a major efficiency boost to corporate strategy teams. An exemplary prompt recipe for slide creation is shown below:

  • Strategic Prompt Recipe**: 'Generate a McKinsey-Blue target operating model slide, mapping a hierarchical branching governance tree with a sidebar list of key team leads.'