 XLSlides
Start with a tonne and a question
A copper map is most useful when a location leads to a question you can check. A mine can sit beside a smelter and still ship its concentrate across the Pacific. A refinery can run far below its nameplate because it cannot buy feed. A port can be the outlet for a whole copper belt without handling a tonne of its own production. Begin with one asset, read the selected record and decide what the map actually establishes before drawing a wider conclusion.
The atlas brings together the owner's documentary research on copper mines and projects, concentrators and tailings facilities, smelters and acid plants, refineries and SX-EW plants, rod mills and fabricators, ports, rail lines, warehouses and desalination plants, plus the headquarters of the companies that control them. It adds concentrate, refined copper and scrap flows, money items such as royalties and taxes, and a table of sourced facts. Search for a mine, company, plant, port or country; select a result; then switch off the layers that are not relevant to your question.
The reference model is 2025, built into this explorer on 13 November 2026. That does not mean every number is a calendar-2025 observation. Some records use fiscal years ending in June 2025 or March 2026, some use guidance or part-year figures, and some describe earlier years. The page keeps those distinctions visible rather than presenting a live copper market monitor. It does not track prices, exchange stocks or shipments in real time.
Read contained copper, concentrate and ore
Quantities in the atlas are thousand tonnes of contained copper, abbreviated kt. That is the metal inside a product, not the weight of the product. The difference matters at every step. A mine moves hundreds of tonnes of rock for each tonne of copper; the owner's research models about 130 tonnes of ore per tonne of copper at a typical modern grade, before waste rock. Copper concentrate usually carries roughly a quarter of its weight as copper, so a cargo of one million tonnes of concentrate holds about a quarter of a million tonnes of metal. Cathode, the refined product, is about 99.99 percent copper.
Ore grade is a percentage of copper in rock. A grade of 0.6 percent means about six kilograms of copper in a tonne of ore, before losses in the mill. Grade explains why two mines of similar output can have very different footprints, water needs and costs, and why falling grades push output down even when a pit keeps moving the same tonnage.
Company reports use other units too. North American producers publish million pounds, Mlb; one million pounds is about 454 tonnes. Some polymetallic mines publish copper-equivalent output, which converts zinc, lead, gold or silver into copper at assumed prices. The atlas shows such figures as text and does not treat them as copper tonnes.
Follow the layers from pit to wire
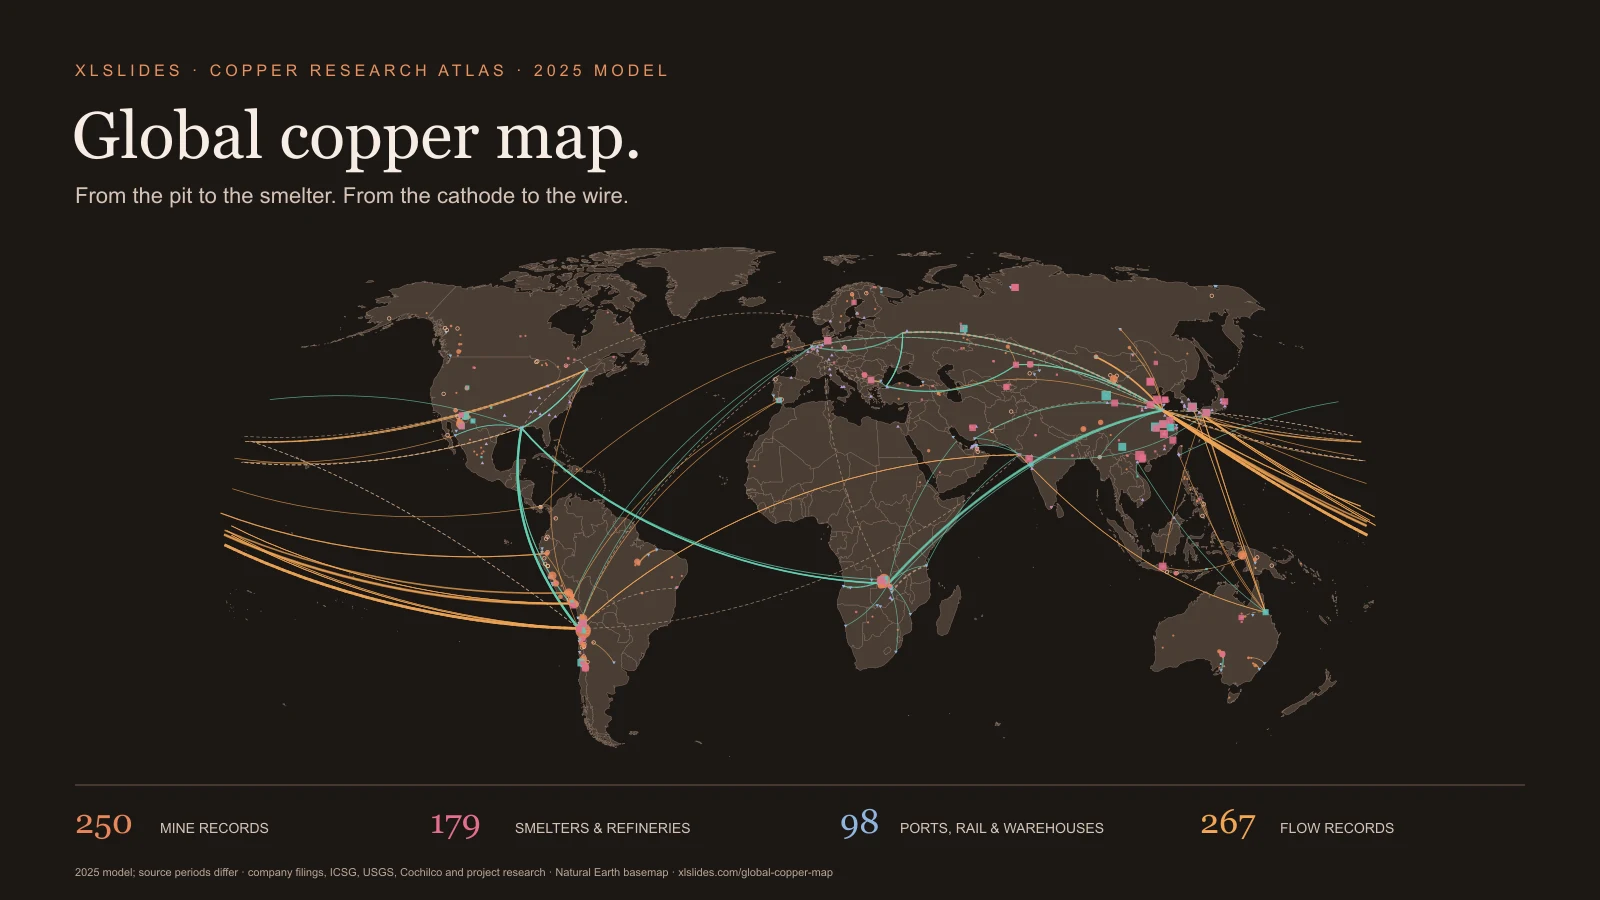
Mines appear as copper circles sized by a single-site 2025 copper figure when the record has one. Projects and artisanal areas are open rings; many are years from production. Concentrators and tailings facilities are small diamonds that sit beside the mines they serve.
Smelters are rose squares and refineries and SX-EW plants are teal squares. They are sized by recorded output, or by recorded capacity when no output is given. Rod mills and fabricators are violet triangles. Ports, rail lines and warehouses are blue triangles pointing down, and desalination plants are small blue circles. Company headquarters are switched off by default because a head office is not where copper is produced.
Flows are curves. Orange curves carry concentrate or ore, green curves carry refined copper such as cathode, rod or wire, and dashed brown curves carry scrap, anode, blister or mixed products. Line width follows the recorded copper tonnage where there is one.
Separate mining, smelting and refining
Copper changes hands and countries between the pit and the wire, and each step has its own geography. According to the ICSG figures used by the research, world mine output in 2025 was about 23.2 million tonnes, and about 5.1 million tonnes of that was SX-EW cathode produced at mines by leaching and electrowinning, without a smelter. The rest left mines as concentrate. Smelters turn concentrate into anode, and refineries turn anode into cathode; the ICSG puts world refined output at about 28.7 million tonnes because refineries also treat scrap.
The countries that mine copper are not the countries that refine it. The research's fact-check puts China at roughly 8 percent of world mine output but about 48 percent of refined output. Chile mines nearly a quarter of the world's copper, yet its smelters recorded their lowest output on record in 2025. Peru ships almost everything as concentrate. Japan, South Korea, India and Spain run large smelters on imported feed.
Processing economics shape these maps. Smelters earn treatment and refining charges from miners. The model's facts record a 2026 benchmark charge of zero and negative spot charges, which strain smelters outside China. Sulphuric acid, a by-product of smelting, matters to leach operations in Chile and the Copperbelt, so acid plants and acid prices appear in the records too.
Read flows as documented relationships
A flow record links an origin and a destination named in the research: a mine to its port, a port to a smelter, or a country to a country. Many tonnages are customs totals; others are a mine's output assigned to its known route, or a gross concentrate tonnage converted to copper at an assumed grade, which the research marks as modelled.
The model gives endpoints as words, not coordinates. This explorer places an endpoint at a model site when the wording names one, otherwise at a country hub point taken from the owner's video build. The selected panel says how each end was placed, including where the match was made on name words. Endpoints such as "World", "Asia", "export" or several countries at once are not drawn, so more than a third of the flow records appear only in the table. A drawn line is a documented relationship or trade total between representative points, not a traced shipment.
Customs data records declared movements. Large flows in 2025 reflect real supply chains but also tariff expectations: the research records about 1.63 million tonnes of refined copper imported by the United States, some 700 thousand tonnes more than it used, ahead of a tariff that never came for cathode. Avoid summing flows into a balance; origins, periods and bases differ.
Treat group totals and modelled values carefully
Copper companies report in many ways: by mine, by division, by group, at 100 percent or attributable share. The research keeps that wording. A record can hold a figure for a whole district, a combined pair of mines, a company's cathode from all its plants, or a country total. This explorer reads a number only when the text gives the record's own copper. District and combined figures size the record that holds them, and the linked records that say "included above" carry no number of their own. Group, company and country totals are shown in full but do not set symbol size or enter sums.
Values the research modelled are its own estimates: a share of a group total, a part-year figure scaled to a year, or a conversion from pounds or gross concentrate. Many model money values are conversions at the 2025 LME average of US$9,939 a tonne. The selected panel spells out each modelled value in words and keeps the method the research gave.
Separate reserves, resources and output
Output is what was produced in a period. Reserves are the part of a deposit that can be mined at a profit under stated price, cost and permitting assumptions, reported as proved and probable. Resources are larger and less certain; resources are not reserves. Few site records in this model carry a reserve figure, so the atlas does not map reserves.
The USGS figure used by the research puts world reserves at about 980 million tonnes of copper. Dividing that by annual mine output gives a static ratio of about four decades, which is often misread as the time until copper runs out. Reserves rise with price, technology and drilling, so the ratio describes a working inventory, not the copper left in the ground. The research also notes that it read the USGS country table from pages that reproduce it, because the original PDF could not be opened.
Keep the period, basis and verification beside the number
Only 94 of the 250 mine records carry a single-site 2025 copper figure. Together they sum to about 14.3 million tonnes, against roughly 23 million tonnes of world mine output in the ICSG and USGS figures. The gap is coverage, not a correction: many mines carry no figure, are included in a district or group total, or are not in the model at all. Treat the sum as an indicator of how much of the world the named records describe, never as a total.
Periods differ. BHP and Indian producers report fiscal years, Mexican records cite 2024 national statistics, and some records use guidance or a part-year figure. Stages differ too: one record measures copper in concentrate, another cathode, another anode. The selected panel names the period and stage whenever the text gives them.
The owner's research flags many fields for checking, most often notes, owner stakes and start years, and some records cite background knowledge that was not verified. A flag is not a correction; it tells you which fields need a primary source before they carry weight in a decision.
Use four starting points to test a story
Start with Escondida to read the world's largest copper mine: one record with output, capacity, owners, process route and water source, which the research says out-produced all of Codelco's own divisions in 2025. Then open the Guixi smelter to see how a Chinese plant's smelter and refinery capacities are recorded and which figure sizes the symbol.
Use the Lobito corridor to read a port whose wording describes cargo and a target, not copper tonnes, and follow the rail and cathode flows that run to it from the Copperbelt. Then select Kamoa-Kakula to see how a whole-complex figure, linked mine records and a new smelter sit together.
These starting points follow the documentary's tonne from a pit, through a smelter and a corridor, to the coast. They do not establish that a particular cargo made that journey. When an argument needs that connection, add contract, customs or company evidence appropriate to the claim.
Build a presentation around inspectable evidence
Choose one decision question before exporting a map image: concentration of mine supply, dependence on Chinese smelting, exposure to a single corridor or port, or the effect of a smelter closure on a region. Use the map for location and relationships, then a small table for quantities. Keep the unit, period, stage and verification status next to the conclusion.
Avoid a crowded slide that asks a reader to infer the whole model. Show the relevant region or layer, state the observation in the headline and keep the source limitation in a legible note. The consulting presentation guide can help structure the argument; the global oil atlas, global gas atlas, global coal atlas and global gold atlas provide companion views of other commodity systems.
Retain attribution when reusing the downloadable snapshot. The JSON contains the rendered atlas, the parsed readings and the provenance notes, not every research file in the source project, such as the price, stock, control and demand tables. Review publisher terms and verify the inputs central to your conclusion.